Inspect Element: How to Temporarily Edit Any Webpage
There's a powerful tool hiding in your browser: Inspect Element.
Right-click on any webpage, click Inspect, and you'll see the innards of that site: its source code, the images and CSS that form its design, the fonts and icons it uses, the Javascript code that powers animations, and more. You can see how long the site takes to load, how much bandwidth it took to download it, and the exact color used in its text.
Or, you could use it to change anything you want on the page.
Inspect Element is a perfect way to learn what makes the web tick, figure out what's broken on your sites, mock up what a color and font change would look like, and keep yourself from having to Photoshop out private details in screenshots. It's a super-power you never knew your browser possessed.
Let's learn how to use Google Chrome Inspect Element to help your work, whether you're a developer or a marketer who's never written a line of code. If you're reading this on your phone, it's time to switch over to your laptop, open Google Chrome, and get ready to tweak some code.
Wait, Why Should I Use Inspect Element?
Google Chrome Inspect Element lets you view a website's source code and tweak anything you want
If you've never peeked at a website's code out of curiosity, you might be wondering why you should learn how to use Inspect Element.
- Designer: Want to preview how a site design would look on mobile? Or want to see how a different shade of green would look on a signup button? You can do both in seconds with Inspect Element.
- Marketer: Curious what keywords competitors use in their site headers, or want to see if your site's loading too slow for Google's PageSpeed test? Inspect Element can show both.
- Writer: Tired of blurring out your name and email in screenshots? With Inspect Element, you can change any text on a webpage in a second.
- Support Agent: Need a better way to tell developers what needs fixed on a site? Inspect Element lets you make a quick example change to show what you're talking about.
For these and dozens of other use cases, Inspect Element is a handy tool to keep around. It's part of the Developer Tools in your browser, which includes a number of extra features: a console to run code, a View Source page to see just the raw code behind a site, a Sources page with a list of every file loaded in a website, and more. You can explore all those on your own, but for now, let's see how to use the main Elements tab to tweak a webpage on our own.
How to Get Started with Inspect Element
There are a few ways to access Google Chrome Inspect Element. Just open a website you want to try editing (to follow along with this tutorial, open Zapier.com, then open the Inspect Element tools in one of these 3 ways:
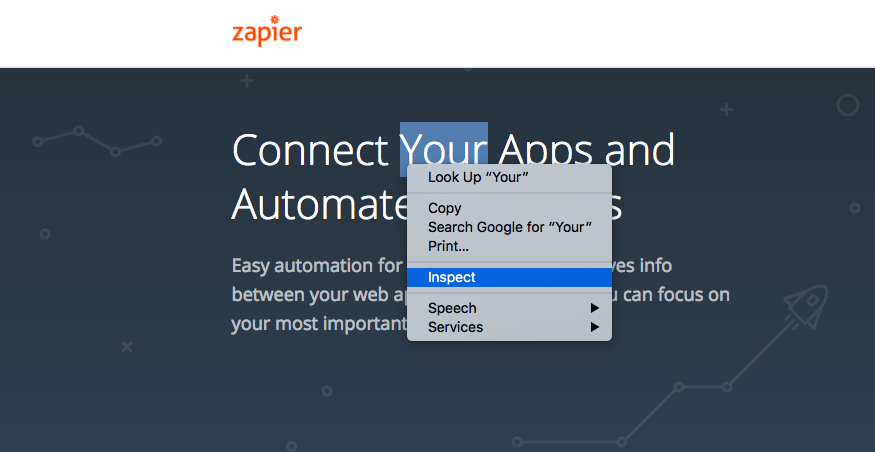
- Right-click anywhere on the webpage, and at the very bottom of the menu that pops up, you will see "Inspect". Click that.
- Click the hamburger menu (the icon with 3 stacked lines) on the far right of your Google Chrome toolbar, click More Tools, then select Developer Tools. Alternately, in the file menu, click View —> Developer —> Developer Tools.
- Prefer keyboard shortcuts? Press
CMD+Option+Ion a Mac, orF12on a PC to open Inspect Elements without clicking anything.
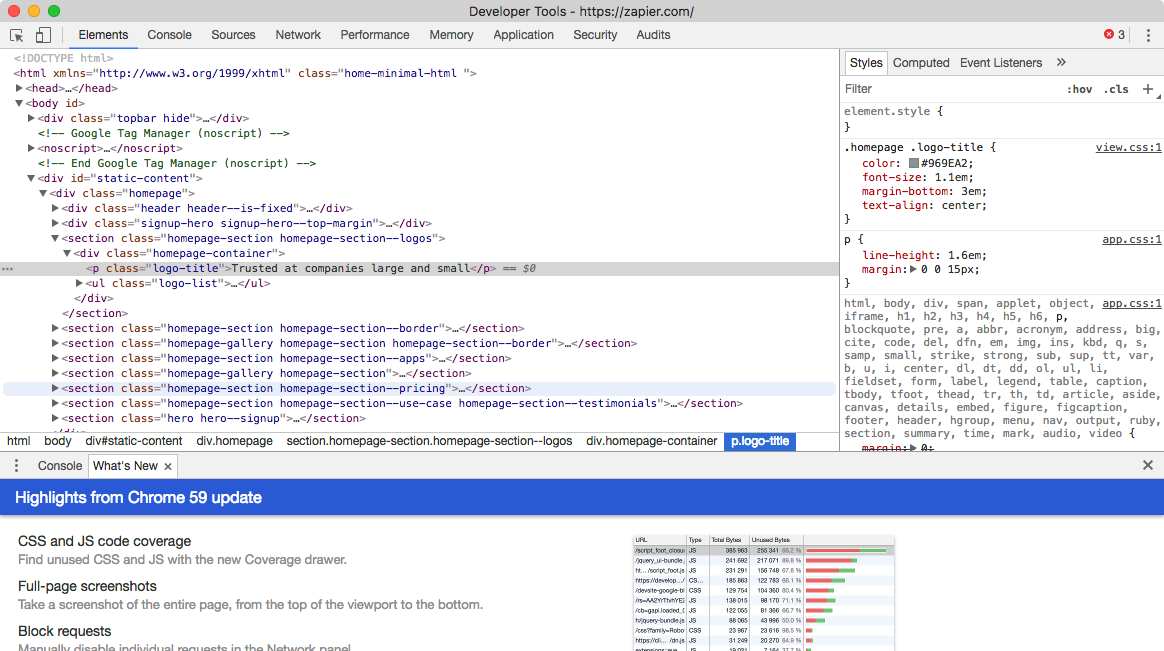
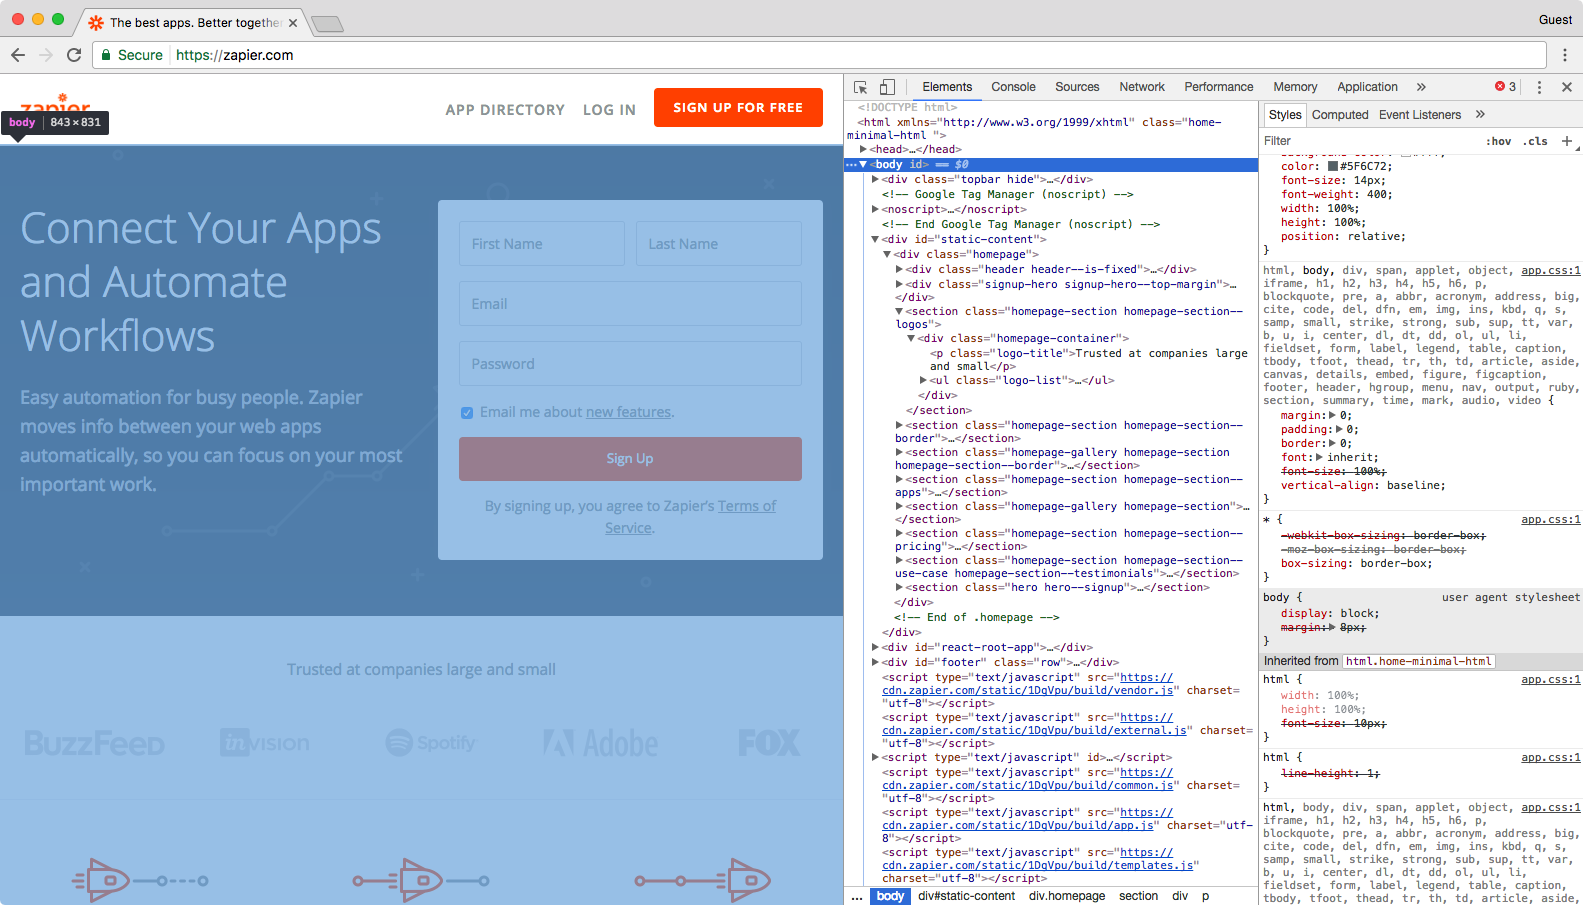
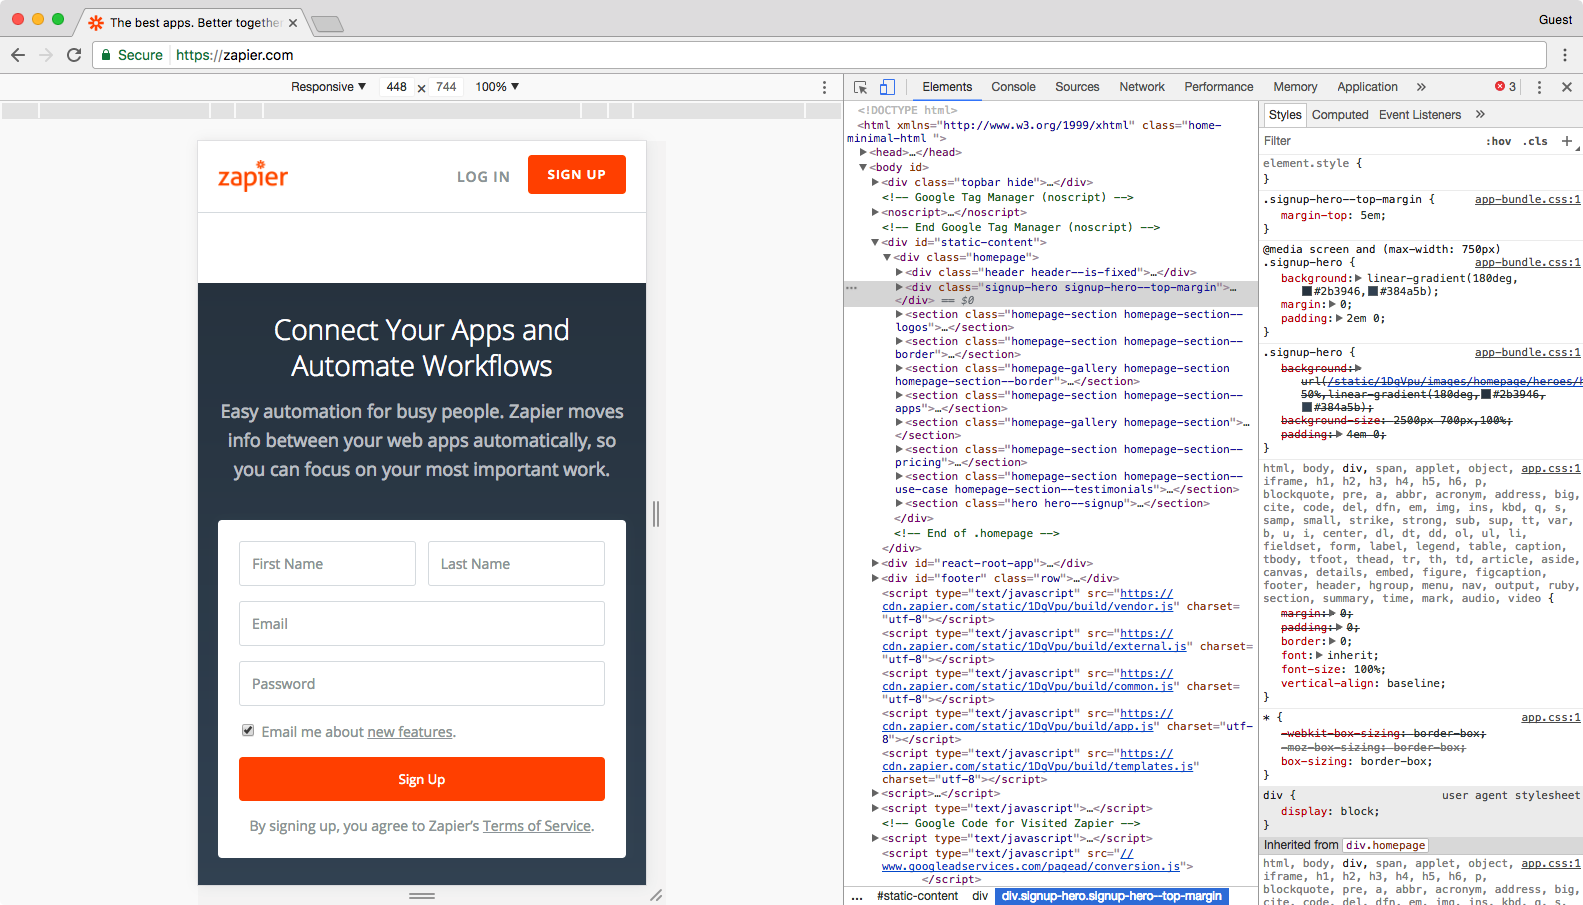
By default, the Developer Tools open in a pane at the very bottom of your browser, and will show the Elements tab—that's the famed Inspect Elements we've been looking for.
You won't have much space to work with Inspect Element at the bottom of your screen, so click the three vertical dots on the top right-hand side of the inspect element pane near the "X" (which you'd click to close the pane). Now, you'll see an option to move the pane to the right-hand side of your browser (right-dock view) or to open the pane in a completely separate window (undock view).
For this tutorial, let's dock the pane on the right side of your browser window since it'll give us more space to work. You can make the Developer Tools panel wider or more narrow by hovering over the left-side border. Once the
↔cursor appears, drag the pane left to widen it or right narrow it.
Now that we're in Inspect Element, there an array of useful tools at our fingertips that we can use to make any site look exactly how we want. For this tutorial, we will focus on the Elements, Emulation, and Search tabs.
Search
The "Search" tab allows you to search a web page for specific content or for an HTML element. It's a bit hidden: you'll need to click the 3 dots then click Search All Files to uncover it. Then you'll be able to search through every file in a webpage for anything you want.
Elements
"Inspect Element" is the tool we will explore most in this tutorial, and it's what opens first when you launch the Developer Tools in most browsers. Or, click the "Elements" tab in the Developer Tools to get back to it if you've been exploring elsewhere.
In the Explore tab, you can see all of the HTML, JavaScript, and CSS that built a website. It's almost the same as just viewing the source of a website, with one important difference: you can change any of the code, and see the changes in real-time on the site you have open. You can change anything from the copy to the typeface, then screenshot the new design or save your changes (just go to View > Developer > View Source and save the page as an HTML file, or copy the code changes to your text editor). Once you re-load the page, though, all of your changes will be gone forever.
Emulation
Ever wanted to preview a webpage on a phone without pulling your phone out of your pocket? The "Emulation" tab lets you view a web page as it would look on any device, with presets for popular devices or an option to set your own screen resolution and aspect ratio. You can even set an emulated internet speed, to see how quickly a site would load over dial-up.
It's also a bit hidden: you'll need to open Inspect Element and click the phone icon button to start it. Then, you'll have a perfect tool to understand how others experience a webpage.
It's time to get to work. We'll first use Search to find things on a webpage, then use Elements to edit text and more on a site, and finally will use Emulation to see how our site would look on a phone from a specific location.
Find Anything on a Site With Inspect Element Search
Wondering exactly what goes into your favorite sites? Search is your best tool for that, aside from reading a site's entire source code. You could just open the default Elements view, press
CTRL+F or CMD+F and search through the source code, but the full Search tool will let you search through every file on a page, helping you find text inside CSS and JavaScript files or locate an icon image you need for an article.
To get started, open Zapier.com in Chrome if you haven't already, then open Inspect Element, click the 3 vertical dots in the top-right corner of the Developer Tools pane (near the closing "X"), and select "Search All Files." The Search tab will appear on the bottom half of the Developer Tools pane.

In the search field, you can type anything—ANYTHING—that you want to find on this web page, and it will appear in this pane. Let's see how we can use this.
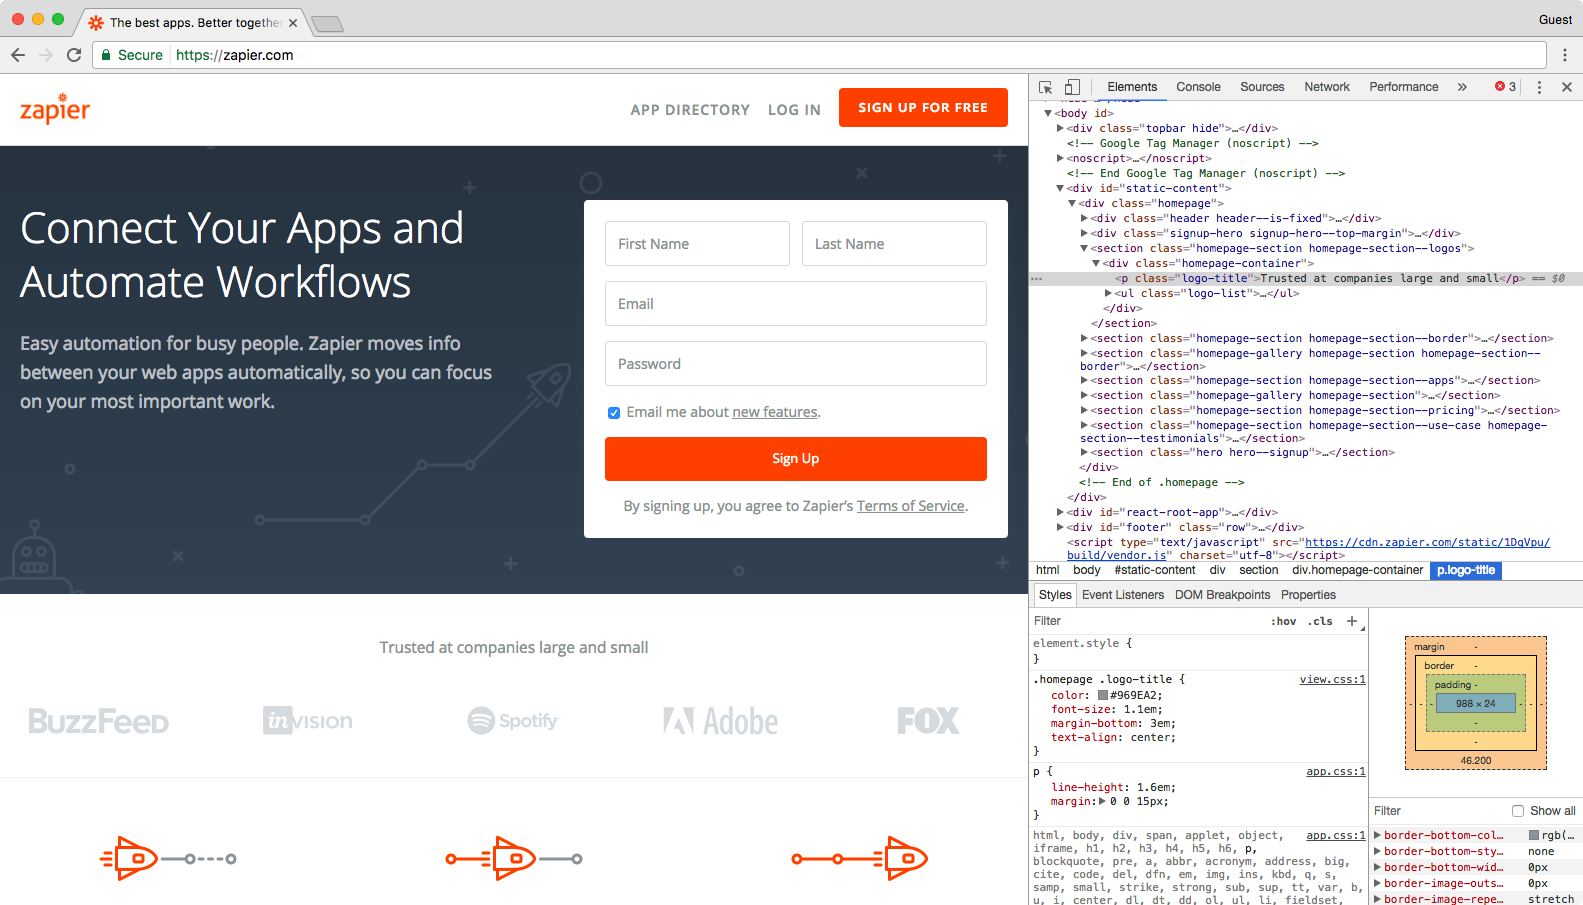
Type
meta name into the search field, press your Enter key, and you'll immediately see every occurrence of "meta name" in the code on this page. Now, you can see this page's metadata, the SEO keywords its targeting, and whether or not it's configured to let Google index it for search. That's an easy way to see what your competitors are targeting—and to make sure you didn't mess anything up on your site.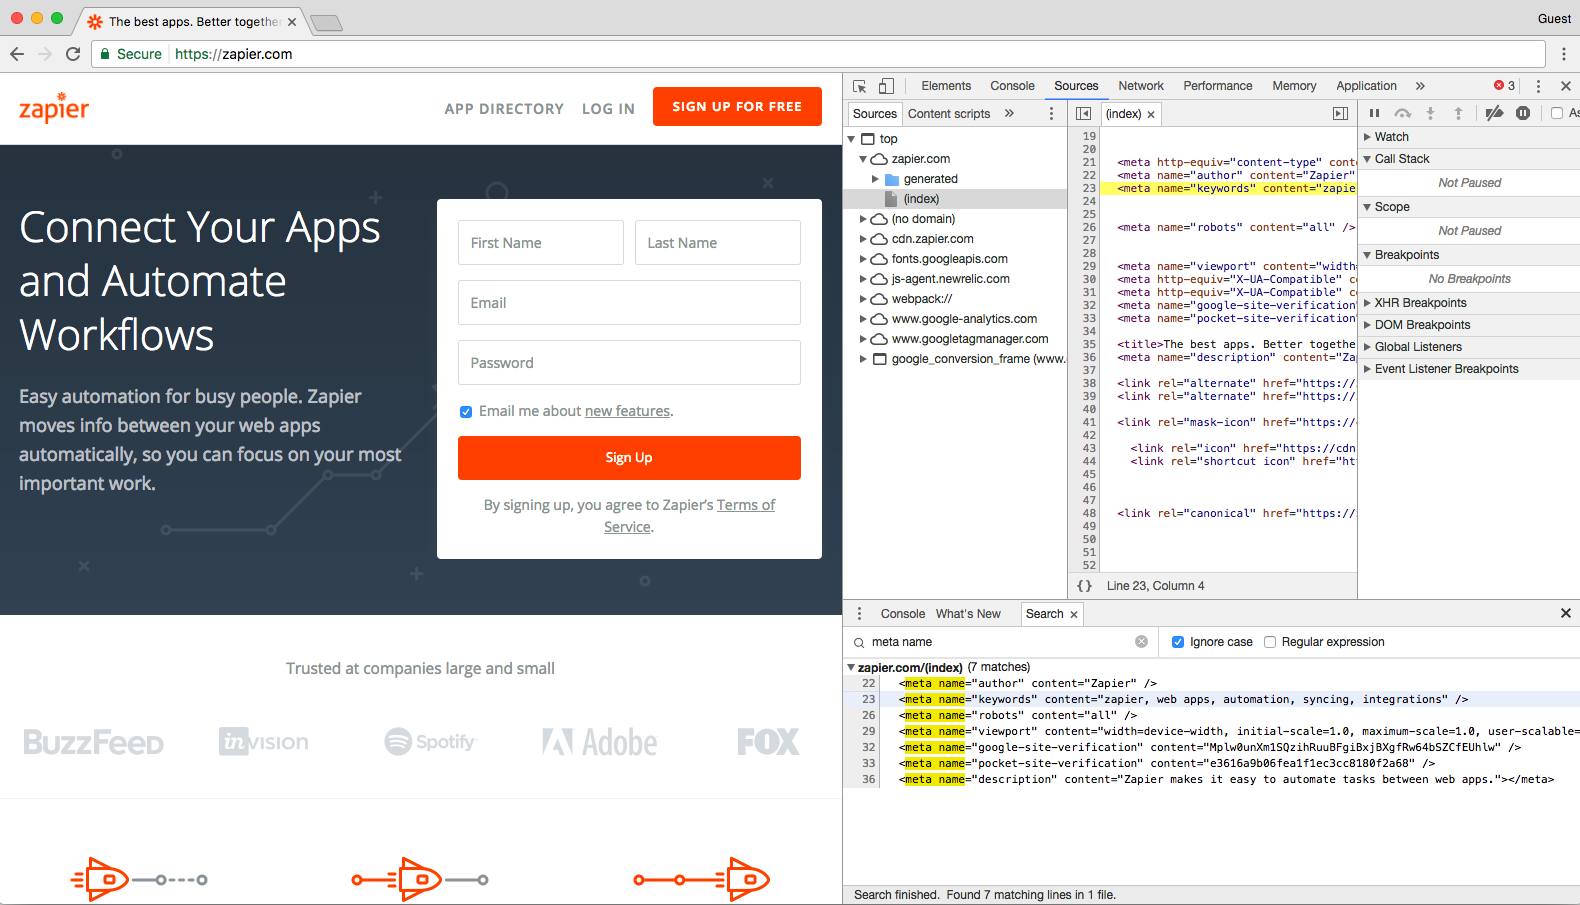
Let's try another query. Delete
meta name, type h2 into the search field instead, and press "enter." You'll see every occurrence of "h2" in Zapier's JavaScript files at the top, but once you scroll to the bottom, you can see every "h2" header on this page.
Search is an effective tool for designers as well since you can search by color, too. Type
#ff4a00 into the search field and press "enter" (and make sure to check the box beside "Ignore case" to see all of the results). You should now see every time the color #ff4a00, Zapier's shade of orange, in this site's CSS and HTML files. Then, just click the line that reads "color: #ff4a00;" to jump to that line in the site's HTML, so you can tweak it on your own (something we'll look at in the next section.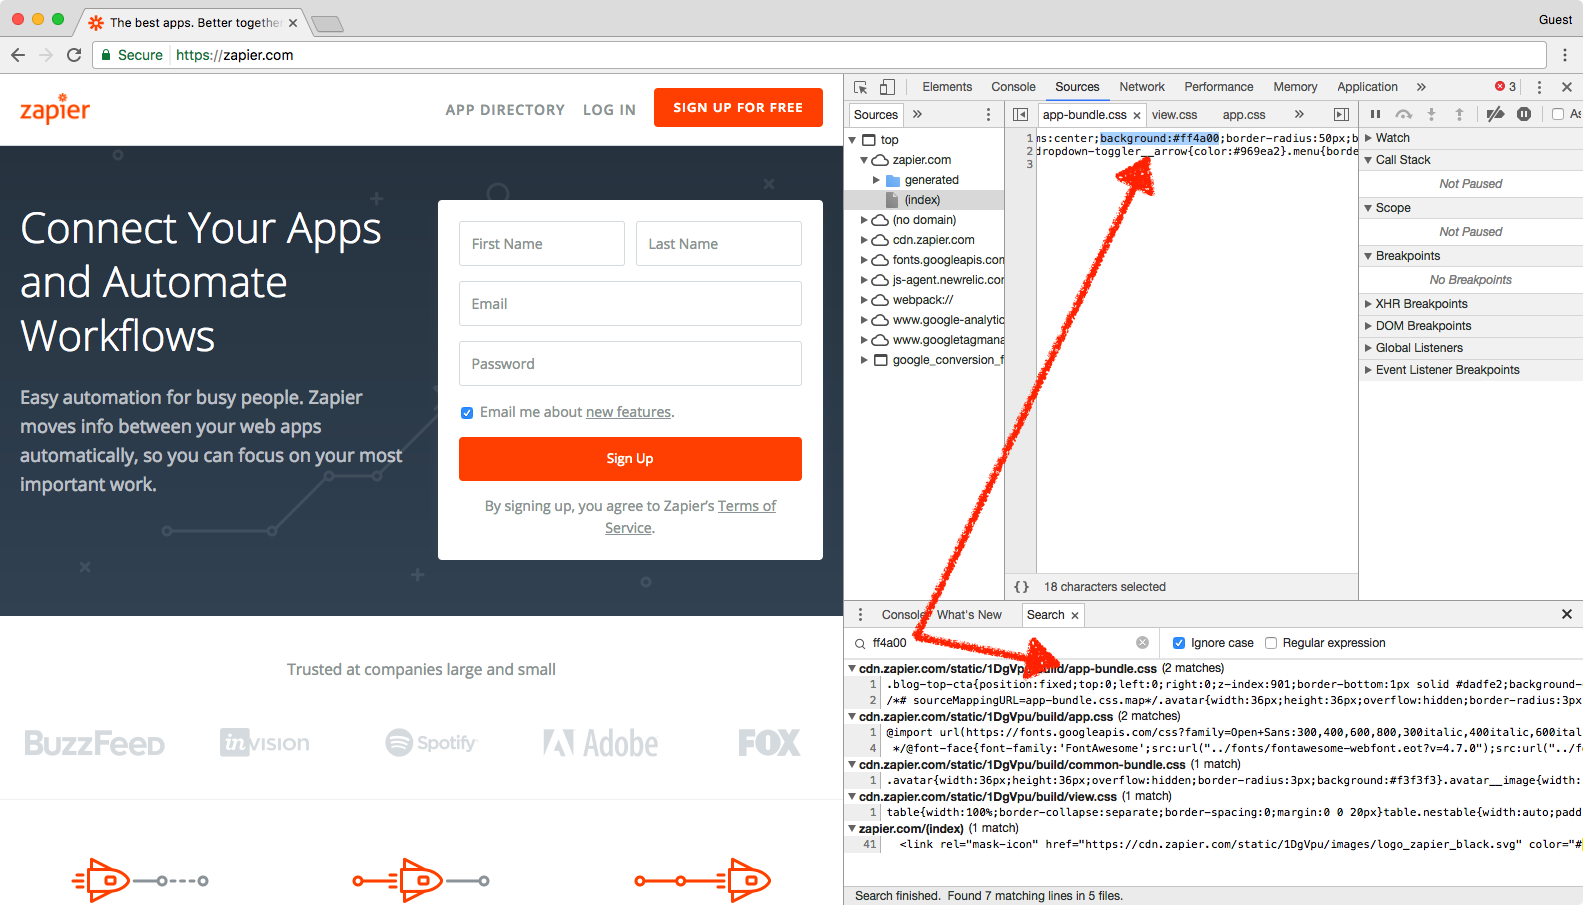
This is a handy way for designers to make sure that a site is following their brand's style guide. With the "Search" tool, designers can easily check the CSS of a web page to see if a color is applied to the wrong element, if an incorrect font-family is used on a web page, or if you're still using your old color somewhere on your site.
The "Search" tool is also the perfect way to communicate with developers better since you can show them exactly where you've found a mistake or exactly what needs changing. Just tell them the line number where the problem exists, and you'll get your fix that much quicker.
Or, you can change the web page yourself with the Elements, the core part of Chrome's Developer Tools.
Change Anything with Elements
Front-end developers use the Inspect Element tool every day to modify the appearance of a web page and experiment with new ideas—and you can, too. Inspect Elements lets you tweak the appearance and content of a web page, by adding temporary edits to the site's CSS and HTML files.
Once you close or reload the page, your changes will be gone; you'll only see the changes on your own computer and aren't actually editing the real website itself. That way, you can feel free to experiment and change anything—and then copy and save the very best changes to use again later.
Let's see what we can do with it.
Click the "Elements" tab in the Developer Tools pane—and if you want more room, tap your "Esc" key to close the search box you had open before. You should see the HTML for this page—now you know how the sausage gets made.
In the top-left corner of the developer pane, you will see an icon of a mouse on top of a square. Click it, then you can select any element on the page that you would like to change. So let's change some things!
Change the Text on a Webpage
Ever wanted to change text on a site—perhaps to see how a new tagline would look on your homepage, or to take your email address off of a Gmail screenshot? Now you can.
Click the "mouse on top of a square" icon, then click any text on the page—perhaps the tagline on the Zapier homepage. In your Developer Tools pane, you will see a line of text with a blue highlight that looks something like this:
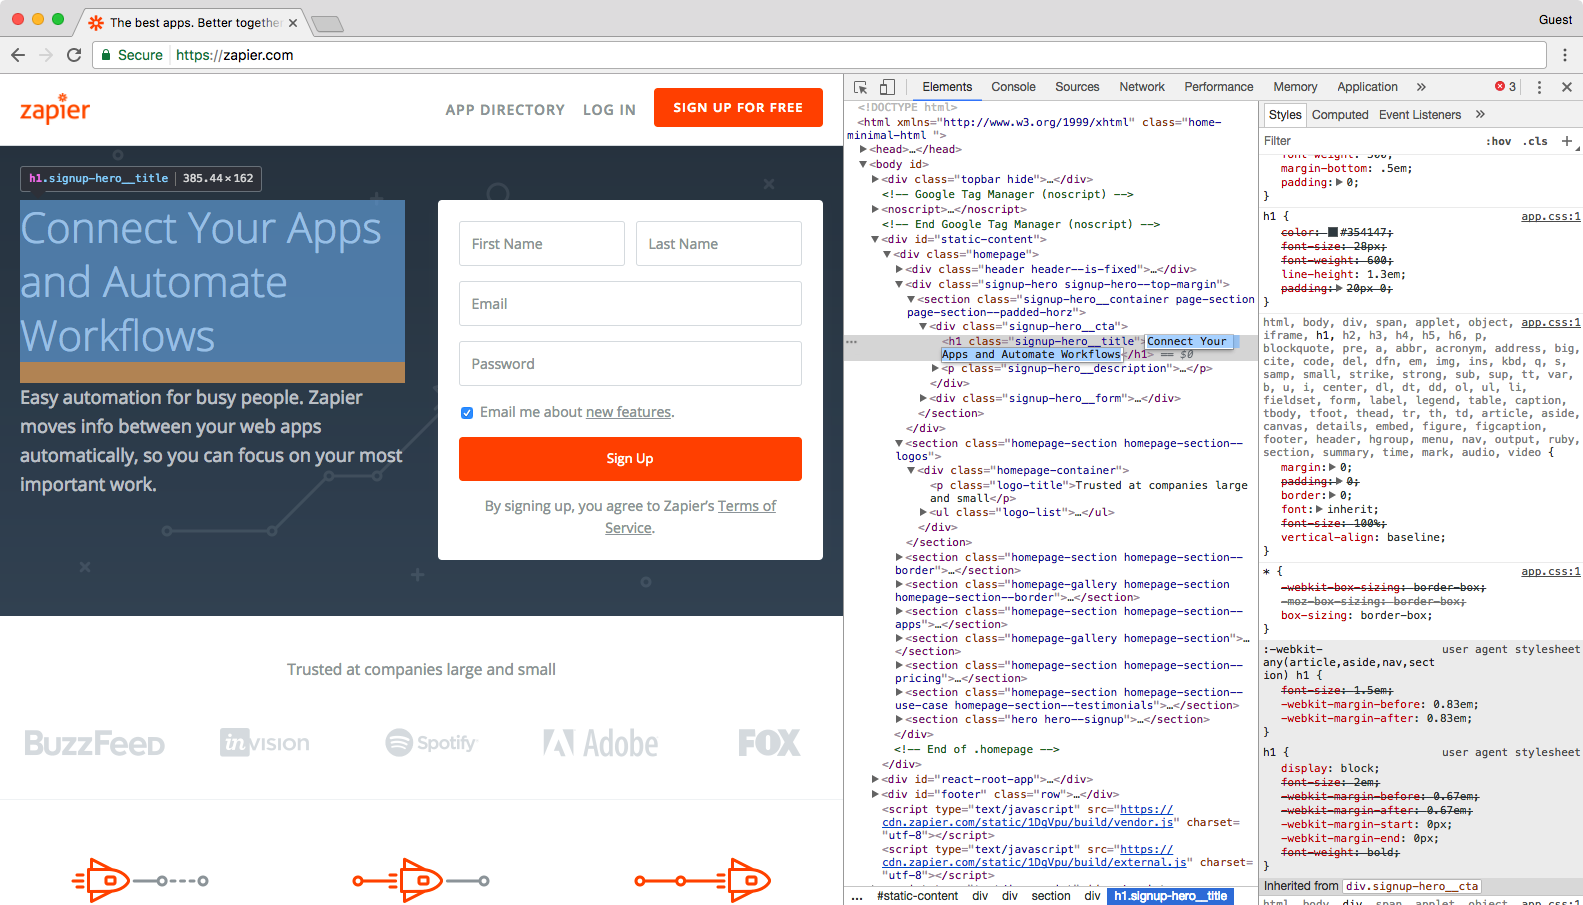
Double-click the "Connect Your Apps" text that's highlighted blue in the Developer Tools pane, and it will turn into an editable text field.
Type anything you like in this text field ("Auri is a genius" should work just fine), and press enter. Voila! You've just changed the text on the web page.
Refresh the page, and everything will go back to normal.
Fun? Let's change some more things on this page.
Your Developer Tools pane re-loads with the page, but let's close it. Press the "X" in the top-right corner of the page.
Cool. Now we're going open it back up—right at the text we want to edit. All you have to do is right-click on the part of the page you want to edit, then click the Inspect or Inspect Element link that appears on the bottom of the right-click menu.
When your Developer Tools pane opens, it should automatically highlight that sentence. Pretty neat, huh? It's the little things that count.
Now that we've selected the tagline on the Zapier site, let's change how it looks.
Change the Color and Font of Elements
To the right of this sentence in the Developer Tools pane, you will see a sub-pane with 3 additional tabs: Styles, Computed, and Event Listeners. Each allows you to change how this sentence looks on the page. Let's get started on "Styles" tab.
You may notice that some things are crossed out in the "Styles" tab. This means that these styles are not active for the element we've selected them, so changing these values will have no effect. We can ignore these for our purposes.
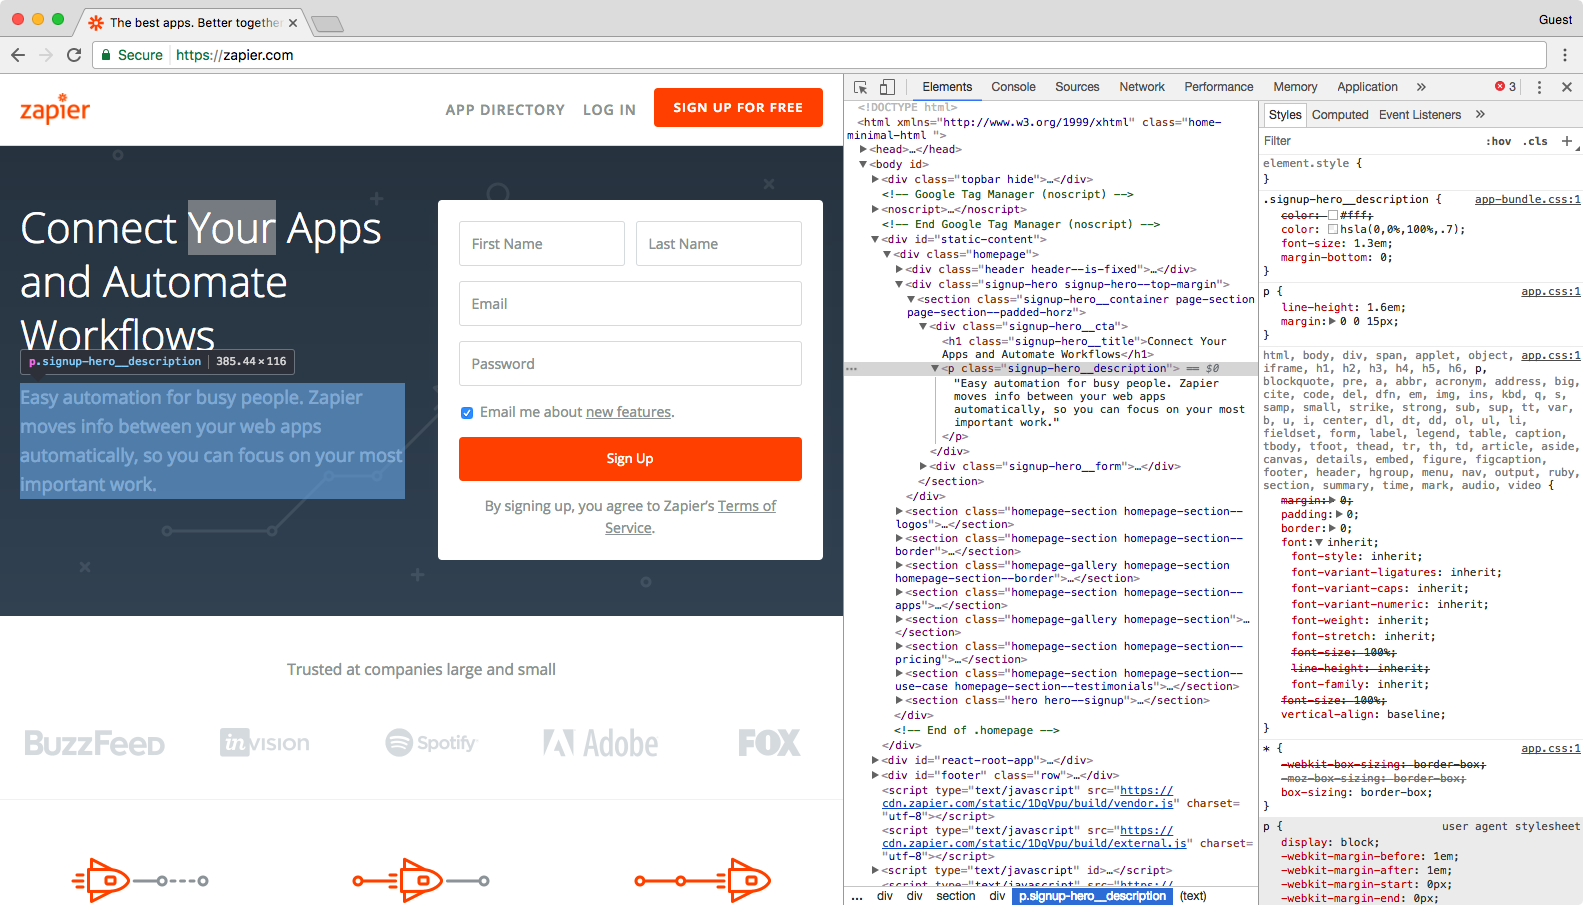
Let's try changing something. Click the arrow icon in the top of Inspect Element again, and select the text right under the "Sign Up" button on the page. Find "text-align" in the "Styles" tab (you may have to scroll a bit to find this).
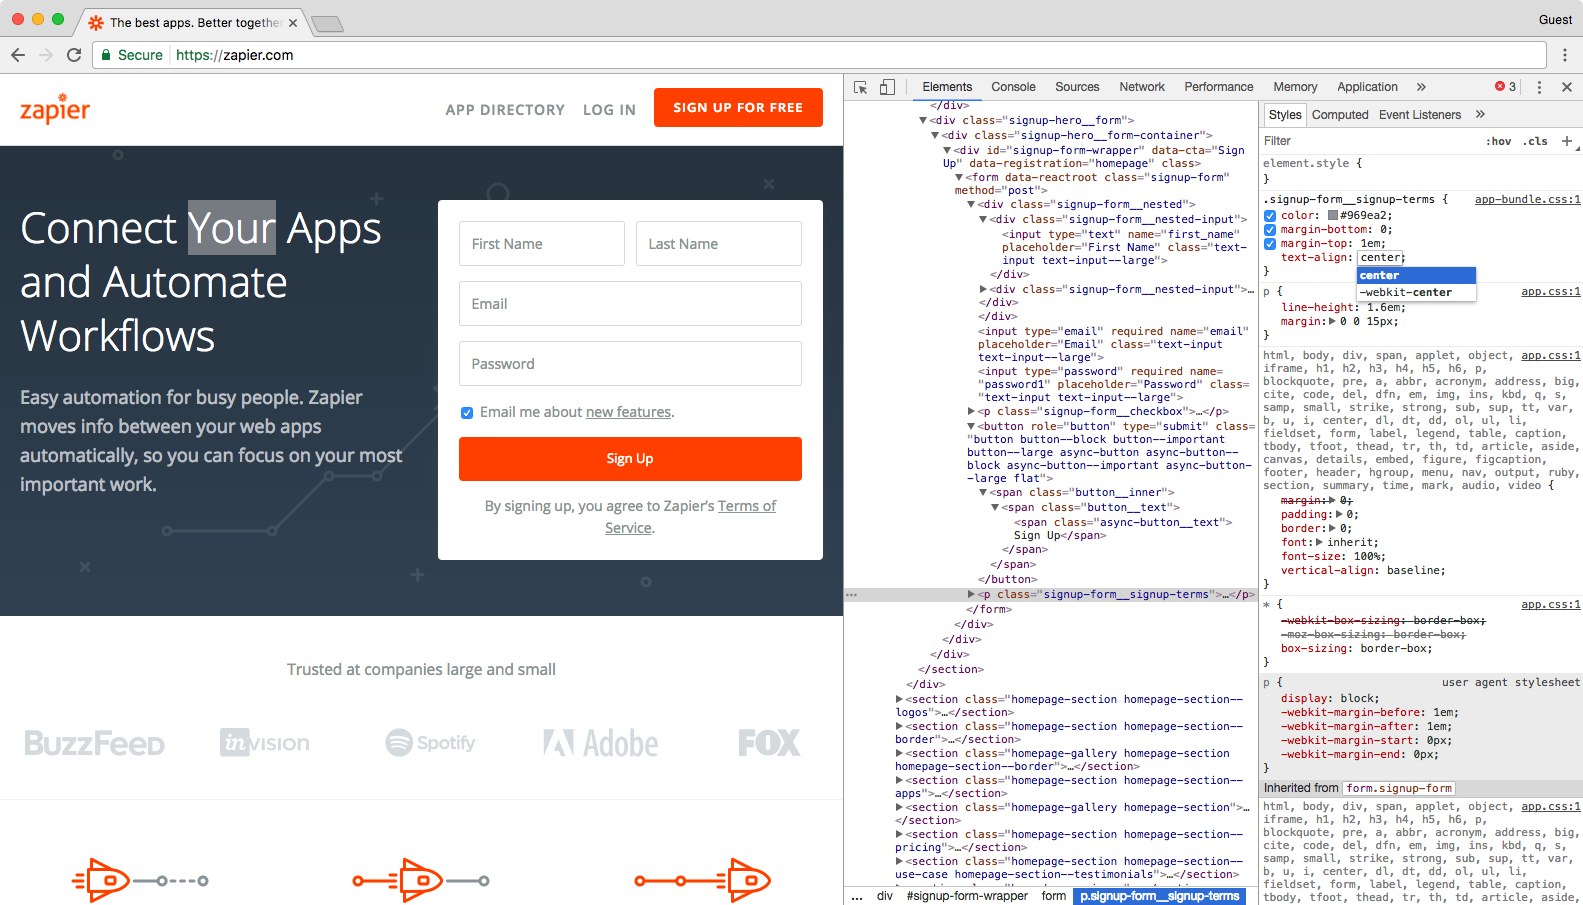
Right now, it is set to "center", but double-click "center" and type
left. This makes the text left-aligned on the page.
Now let's play around with the color. Use the mouse icon in Inspect Element to select the button this time, then in the Styles tab find this line:
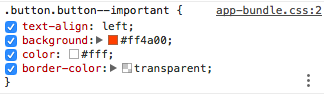
And double-click "#ff4a00". Type
#4199ad (do not forget the #) and press "enter."
We just changed the color of our button from orange to blue! Now let's try something really cool.
Change Element States
Want to see how a button or link will look once someone hovers over or clicks it? Chrome Inspect Element can show that too with its force element state tools. You can see how the element will look once a visitor hovers over the element (hover state), selects the element (focus state), and/or has clicked that link (visited state).
Let's try this out. Make sure you've selected the signup button on the Zapier home page. Then, right-click on that code in the Elements tab, and select
:active: in that menu.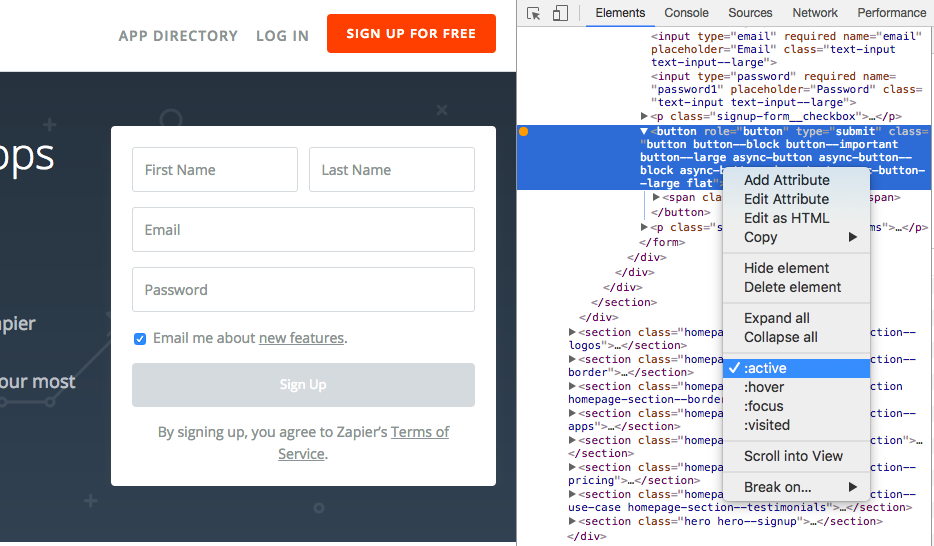
That will change the button to grey, which Zapier's site shows as you click the button.
Now change the background-color value to
#FF4A00, and you should instantly see the button color change.
Try experimenting—change the
:hover: color, then un-check :hover: in the right-click menu and drag your mouse over the button to see the new button color.Change Images
You can easily change images on a web page with Inspect Element, too. Let's swap the Superhero background on the Zapier site with this dramatic photo of a solar flare from NASA.

First, copy and paste this link to the image:
https://c1.staticflickr.com/9/8314/7931831962_7652860bae_b.jpg
Now, open Inspect Element on the background of the Zapier homepage, and make sure you've selected the
signup-hero line in the code. Double-click the background URL link in the "Styles" pane, and paste the link you copied above.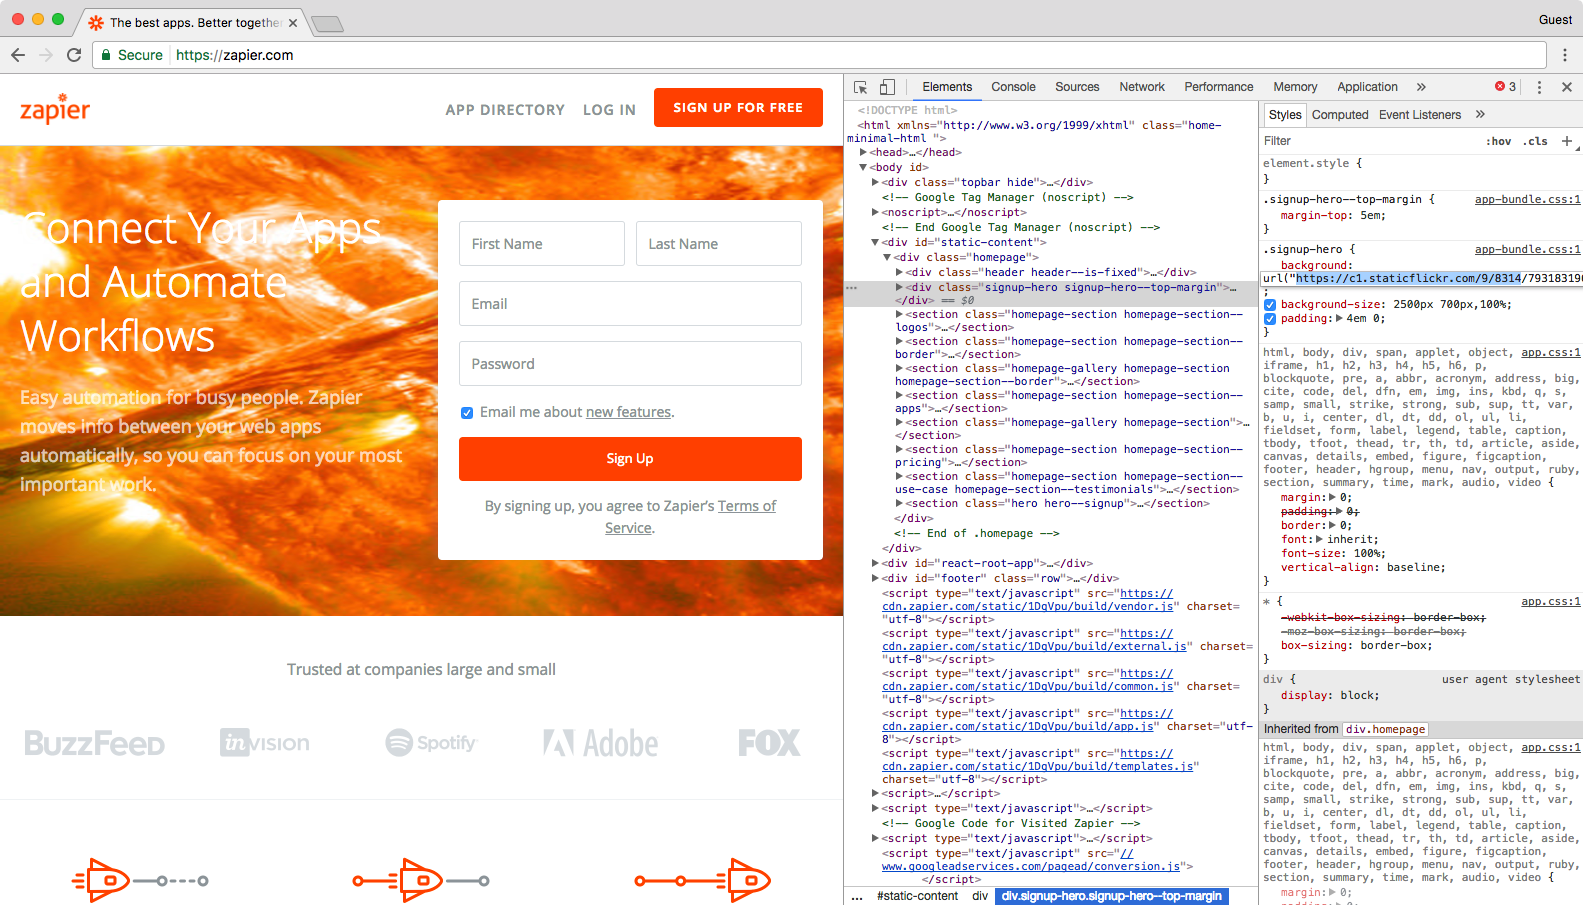
Press "enter" and see the difference immediately.
Editing text is handy, swapping out images is fun, and changing colors and styles just might help you quickly mockup the changes you want made to your site. But how will that new tagline and button design look on mobile?
That's where Emulation comes in—it's where everything we've reviewed so far can be applied even further. Let's see how.
Test a Site on Any Device With Emulation
Everything has to be responsive today. Websites are no longer only viewed on computers—they're more likely than ever to be viewed on a phone, tablet, TV, or just about any other type of screen. That should always be kept in mind when creating new content and designs.
Emulation is a great tool to approximate how websites will look to users across various devices, browsers, and even locations. Though this does not replace actually testing on a variety of devices and browsers, it's a great start.
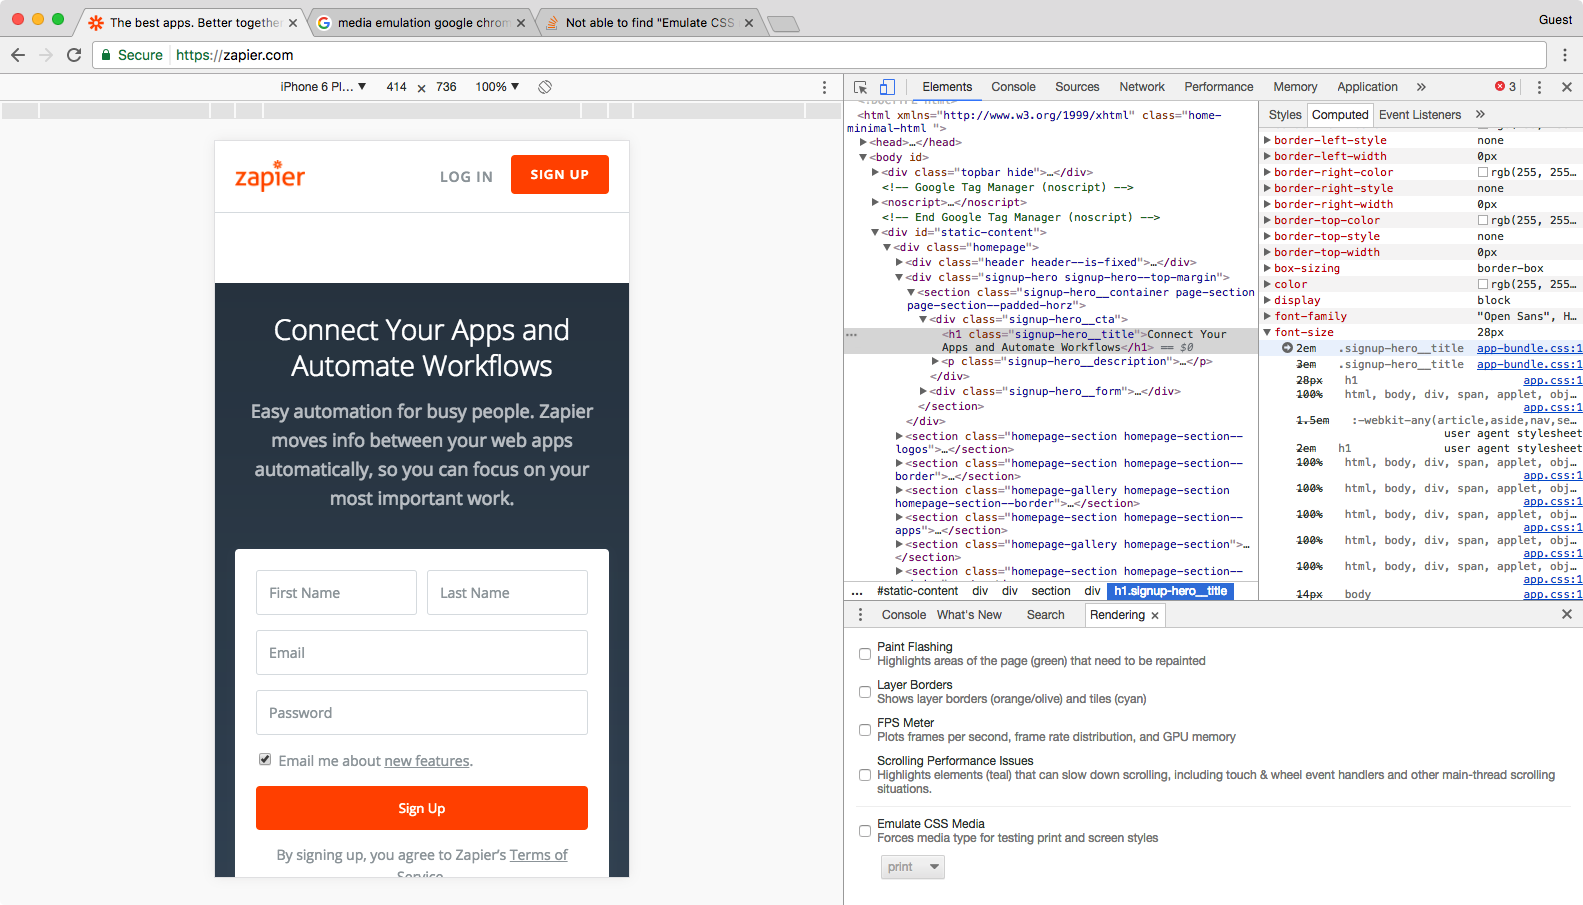
In the Developer Tools pane, you'll notice a little phone icon in the top-left corner. Click it. This should change the page into a tiny, phone-styled page with a menu at the top to change the size.
Resize the small browser to see how things look if you were browsing on a tablet, phone, or even smaller screen. Or, click the menu at the top to select default device sizes like
iPad Pro or iPhone 6 Plus—go ahead and select the latter.
The web page screen should shrink down to an iPhone 6 Plus' size, and you can zoom in a bit by clicking the + icon next to the number at the top right of the grid—that's how the site would look if someone zoomed in on mobile.
Go ahead enlarge the view by dragging the right edge of the web page emulation right. See what happens? We're no longer in the iPhone 6 Plus view. Dragging the screen along the grid allows you to see how the web page will change as the screen size changes, but your view will no longer reflect the device model that you chose previously.
Let's go back to the iPhone 6 Plus view by selecting this in the model drop-down list again. Next to the drop-down list is the word "Portrait." As you may have guessed, this allows you to toggle between the landscape and horizontal view.
Now, we can see how this post would look if you were reading it on an iPhone 6 Plus. Feel free to play around with the other devices to see how this web page and the screen resolution changes. All of the other developer tools that we have gone over so far will also react to the device view. For example, select the text of Zapier's tagline again.
In the iPhone 6 Plus view, we can see that this text is 2em, while in the default view on a computer, it's 3em.
The "em" is a font-size unit that allows you to automatically change the size of text relative to the surrounding text. For example, let's say we have a user with large custom font settings on their browser. If you set your paragraph font-size to 14px, your font will always be 14px to that user no matter what. However, if you set your paragraph font-size to 1em, your user's browser will use this unit to scale your text to your user's large settings. Phones and tablets do this to zoom text nicely.
Now let's switch to the Apple iPad view and select the "testing across devices" header above. This time, the font-size is 3em. The font-size changed based on the device view, back to the default size it'd use on a computer, thanks to the tablet's larger screen.
Emulate Mobile Device Sensors
You may have noticed that your mouse now appears as a little circle on the web page. This allows you to interact with the page as if you are on your mobile device. If you click while dragging the page down, this does not highlight text like it normally would in your browser—it drags the screen down like you are on a touchscreen device. Using this view, you can see how large touch zones are on a web page. This means that you can see which buttons, icons, links, or other elements are easily touchable with the finger.
You can even make your browser act like a phone. Press your "Esc" key to open the search pane in Inspect Element again, and this time click the 3-dot menu on the left side for a menu of options. Select Sensors to get three new tools: Geolocation, Orientation, and Touch.

Touch lets you turn on or off the default circle selector that acts more like a finger than a normal mouse cursor. Orientation lets you interact with motion-sensitive websites such as online games that let you move things by moving your phone. And Geolocation lets you pretend you're in a different location.
Let's try viewing this site from Google's Headquarters in Mountain View, CA.
Check the box next to "Emulate geolocation coordinates," and enter the value
37 into the Lat = text field and 122 into the Lon= text field. Press enter on your keyboard.
Nothing changes, right?
This is because there isn't content on this page that changes based on your location. If you change the coordinates on a site like
Groupon.com that uses your location to show localized content, though, you would get different results. Go to Google.com in a different location, and you'll perhaps see a new Google logo for a holiday in another country, or at least will get the results in a different language.
Emulation is a great way to put yourself in your user's shoes and consider what the user may be seeing on your web page—and it's a fun way to explore the international web.
By: Hemant Gupta
Contact: +91 9116866718
Comments
Post a Comment